I'M ABOUT TO BREAK A “WEBSITE RULE” IN A BIG WAY: I’m going to give you the nutshellised version of this entire article right at the start. So if you don’t have time or you’re panicking like mad or you can’t be bothered to wade through a 3,500-word diatribe against certain private clinics, you don’t have to.
Here’s the nutshellised version:
- If you want to look at the success rates of an individual clinic, please please please use the HFEA website – which has an info page on every clinic in the country – to do so. Some clinics are incredibly cheeky with how they select and present their data, but the HFEA standardises everything and allows you to accurately compare them all.
(The HFEA certainly isn’t controversy-free – and I have my issues with how it operates – but it’s useful for comparing like-for-like data across fertility clinics.) - Most importantly, try not to obsess over success rates when choosing a clinic. There are far more important factors to consider.
Want more detail? Here you go:
What does “success rate” actually mean? (Don't skip this bit!)
In this article, “success rate” means “live births per embryo transferred”.
It’s the preferred method of the Human Fertilisation and Embryology Authority (HFEA) for assessing IVF success, and I agree that it’s the most useful measure in most instances. I’ll get into this in more detail soon.
What are the national average success rates for IVF?
The following percentages are from the HFEA (2017 data). They show the average chance of a live birth after IVF treatment per embryo transferred, using a woman’s own eggs and partner’s own sperm:
- Aged under 35: 29%
- 35-37: 23%
- 38-39: 15%
- 40-42: 9%
- 43-44: 3%
- Aged over 44: 2%
Frozen and fresh transfers have been combined in these percentages. If you'd like to see the numbers divided out between frozen and fresh, you can check the HFEA's Fertility Trends report – where you can also see data for donor eggs, donor sperm, and other forms of IVF.
I'll be using the above percentages as my benchmark throughout this article, purely for consistency and so I can show what private IVF clinics do to make their own success rates look better than they really are.
How do I find the success rates of a specific private fertility clinic?
Visit the website of the Human Fertilisation and Embryology Authority (HFEA). I have my criticisms of the HFEA (another time!), but I do appreciate that it has very strict rules about how clinics must report success rates to it – which means the HFEA can then publish data that can be compared like-for-like with other clinics.
Clinics are free to publish whatever data they want – in whatever format they want – on their own websites. As you'll soon see, they can be very cheeky with how they select and present this data – and that's why I plead with you not to visit individual clinic websites for information about success rates.
Is there much variation in success rates among private IVF clinics?
Excellent question! If you ask any clinic, the answer will be “yes” – and they'll say their success rates are the best. The truth is slightly different…
- As mentioned above, the HFEA's preferred metric is “live births per embryo transferred”.
- The HFEA differentiates between clinics whose success rates are “above the national average”, “consistent with the national average” and “below the national average”.
“Above”, “below” and “consistent with” are calculated by averaging out the success rates for each age group within a clinic. - The vast majority of clinics are classed as having success rates “consistent with the national average”. One criticism of the HFEA is that this category encompasses a wide range of success rates. For example:
CARE Nottingham has success rates of 37% (aged under 38), 14% (38 and over) and 29% (all ages combined).
Harley Street Fertility Clinic has rates of 15% (aged under 38), 6% (38 and over) and 11% (all ages combined). `
Both clinics are considered to be “consistent with the national average” across all age ranges.
(It would be helpful if the age ranges were consistent with the national averages mentioned above, but there you go. Even so, you can still see that CARE Nottingham is much higher than the national average and Harley Street Fertility Clinic is much lower.)
Granted, these are extreme examples, and most clinics are much closer to the national averages. Nevertheless, it makes sense to delve into the clinic's data rather than rely purely on the descriptive statement about success rates at the top of the page.
Should I steer clear of any clinics that have success rates “below the national average” or at the lower end of “consistent with the national average”?
No.
Firstly, only a handful of clinics are “below the national average”. And secondly, as the HFEA says, “… most clinics are broadly all as good as each other – small differences in rates are usually down to the different types of patients treated.”
This is an important point.
Often, variations in success rates are down to differences in the types of patients being treated rather than the expertise of the doctors there.
For example:
- One clinic might refuse to treat anyone with a BMI over 30; a high BMI affects IVF success, no matter how good the clinic is, so that particular clinic may have better success rates than one that will treat anyone regardless of their BMI.
- Statistics are further skewed (albeit slightly) when clinics treat both private and NHS patients. The NHS has much stricter selection criteria, favouring women who have a higher chance of success. The clinics that accept NHS patients are therefore likely to have slightly higher success rates compared to private-only clinics.
Using the example of Harley Street and CARE from above, it's perfectly possible that Harley Street treats a wider range of patients than CARE. I don't know if this is true, but it's a question you could ask if/when you have an appointment there.
You might be wondering about age…
Another drawback and potential criticism of the HFEA’s definition is that it’s less helpful for older women and the clinics that treat them with a double embryo transfer. As we know, age is the most important factor in determining IVF success, and women over the age of 37 are less likely to get pregnant through IVF (or naturally). It’s also less likely that both embryos will develop into foetuses – so the benefits of transferring two embryos are believed to outweigh the risks. A decent percentage of older women may well have a baby after receiving a double embryo transfer from a particular clinic, but that clinic’s success rates “per embryo transferred” will look relatively unimpressive.
If you’re older than 37, I’d recommend that you look at the HFEA’s data for a particular clinic AND any data you can find on “live births per embryo transfer/transfer event”. Also note that the HFEA’s stats separate out clinic data into age ranges, so you can see success ranges per age group (per embryo transferred).
How do IVF clinics mislead us when publishing success rates on their websites?
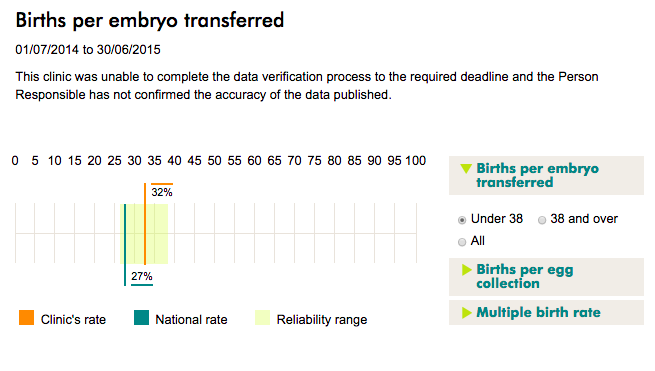
So as we've learnt, clinics generally aren't drastically dissimilar from each other when it comes to success rates. Annoyingly (but understandably) that doesn’t stop them from trying to pretend they’re better. Take Herts & Essex Fertility Centre. If we compare the HFEA data with the data on the clinic’s website, things look… weird. Here’s one example:
HFEA data:
- Live births per embryo transferred (age <38): 27%, which is consistent with the national average
Herts & Essex Fertility Centre data (on its website):
- Live births per embryo transfer (age 20–34): 44.7%
- Live births per embryo transfer (age 35–37): 42.9%
(Combined, these represent the age groups covered by the HFEA data.)
44.7% and 42.9% are nowhere near the 27% stated by the HFEA. So what’s going on?
Three letters is what’s going on. The clinic uses the word “transfer”, whereas the HFEA uses “transferred”. Those three letters make a huge difference.
Here’s how Herts & Essex explained it in an email they sent me:
“The reason for the difference in success rates is because the HFEA data is showing live birth per embryo transferred, whereas the data on our website is showing rates per embryo transfer event, so in actuality are not showing the same thing. [Note that their website doesn’t say “embryo transfer event”; it just says “embryo transfer”.]
Essentially, the differences come from what a measurement of ‘success' is. For example, if a patient were to have a single live birth following the transfer of two embryos, this would be a 50% success rate per embryo transferred because only one of the two embryos implanted. However, according to success rate per embryo transfer event, this would be 100% successful. Similarly, if a patient were to have a singleton live birth following the transfer of three embryos, according to success rate per embryo transferred, this would be a 33% success rate but a 100% success rate according to success per embryo transfer event.”
While this explanation makes sense, there’s a good chance many potential patients will be misled by the Herts & Essex Fertility data. As I said in my reply:
“Don't you think it's misleading to publish ‘per embryo transfer' rather than ‘per embryo transferred'? Surely lots of people are going to compare your stats to other clinics that cite ‘per embryo transferred' and think your clinic has much higher success rates – when actually they're comparing two very different measures?
If nothing else, shouldn't there be an explanation of this difference on your ‘success rates' page?
From what I understand, the HFEA encourages clinics to publish ‘per embryo transferred' data because it wants to deter you from transferring multiple embryos.” [More on this final point shortly.]
I’ve picked on Herts & Essex Fertility because it was one of the first I came across, but believe me: many other clinics are just as sneaky.

Why is “births per embryo transferred” the best metric?
The HFEA has a good reason for preferring the “live births per embryo transferred” statistic:
“Birth rates per embryo transferred (PET)… helps patients and clinics to recognise that whilst transferring more than one embryo at a time is thought to raise success rates, it also raises the chance of twins, which can carry health risks for the babies and mother.”
I won’t go off on a tangent about the health risks associated with multiple pregnancies in this particular article, but you can read more here.
In 2016, the HFEA reported that its efforts to encourage clinics to reduce multiple birth rates has been successful: “In 2008, one in four pregnancies from IVF resulted in a multiple birth, leading us to set a target that no more than 10% of IVF births should be multiples. Working together with patient groups, clinics and professional bodies, the national multiple birth rate has decreased from 24% in 2008 to 11% today, without reducing birth rates [my emphasis].”
Indeed, it seems single embryo transfers aren’t necessarily less successful. In a 2010 meta-analysis, the BMJ discovered that “An additional frozen single embryo transfer [after a failed fresh transfer] resulted in a cumulative live birth rate not significantly lower than the rate after one fresh double embryo transfer”.
That is: “1 embryo fresh transfer” + “1 embryo frozen transfer” = very similar live birth rates to “2 embryos fresh transfer”
Yes, it takes longer to do things this way – but it’s safer.
Why do many clinics publish different metrics on their own “success rates” pages?
Many clinics continue to refer to success rates that are based on “per embryo transfer event” (sometimes referred to simply as “per embryo transfer”) rather than “per embryo transferred”. Why? Because the numbers are higher and therefore look more impressive.
Let's use CRGH (a London clinic) as an example:
- The “live birth rate per embryo transfer” for under-35s (published on the CRGH website) is 50.3%. For those aged 35–37, it's 43.1%.
- The “live birth rate per embryo transferred” for those aged 37 and under (published on the HFEA website) is 29%.
50.3% simply looks way better than 29%. You're more likely to pick up the phone to CRGH if you see a success rate of 50.3% rather than 29%.
What's so bad about reporting different metrics from those preferred by the HFEA?
Clinics will pick and choose the metrics that make them look good, which it makes it very hard to compare success rates accurately. (Which is why I recommend using the HFEA instead.)
But there's another potential harm we haven't yet discussed…
As explained earlier, publishing “per embryo transfer event” stats incentivises them to transfer multiple embryos rather than just one – which is generally NOT in the interests of patients.
It’s possible this is just a theory: clinics that report “per embryo transfer event” might not, in fact, perform more multiple embryo transfers than the national average.
But… well… they do.
I’ve checked the data of many private clinics in the UK, and the ones that report “per embryo transfer event” (which is the same as “per embryo transfer”) on their website tend to have higher multiple birth rates.
While it sometimes makes sense for older women (and a small minority of younger women) to have a multiple embryo transfer, the clinics I looked at have a high multiple birth rate across all age groups – not just older women. Not only that, but many of them (including Fertility Plus, CRGW, City Fertility and many more) also have slightly lower birth rates per embryo transferred than the national average. (Not significantly lower, I must add: they’re still considered “consistent” with the national average.)
I came across one clinic that has INSANE results on the HFEA website (turns out there’s been quite a lot of press coverage about it). The Assisted Reproduction and Gynaecology Centre in London has fairly standard results for “live births per embryo transferred”, yet its multiple birth rate is higher than anything I’ve ever seen for patients under the age of 38:
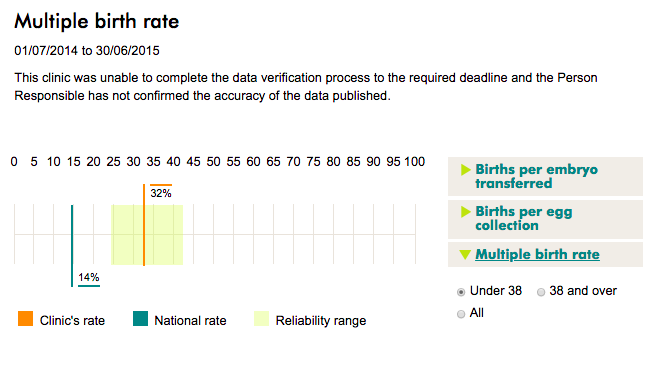
(The national average is now 11% rather than 14%. I’m assuming the HFEA hasn’t updated its charts yet.)
This implies the doctors at the clinic are shoving a buttload of embryos up almost all patients – both young and older. Interestingly, this clinic’s website provides success rates on “clinical pregnancy per cycle started”, which is a confusing measure that most clinics don’t bother publishing (or at least will publish alongside other types of data – like “per embyo transferred”). There’s more about measuring “per cycle started” below.
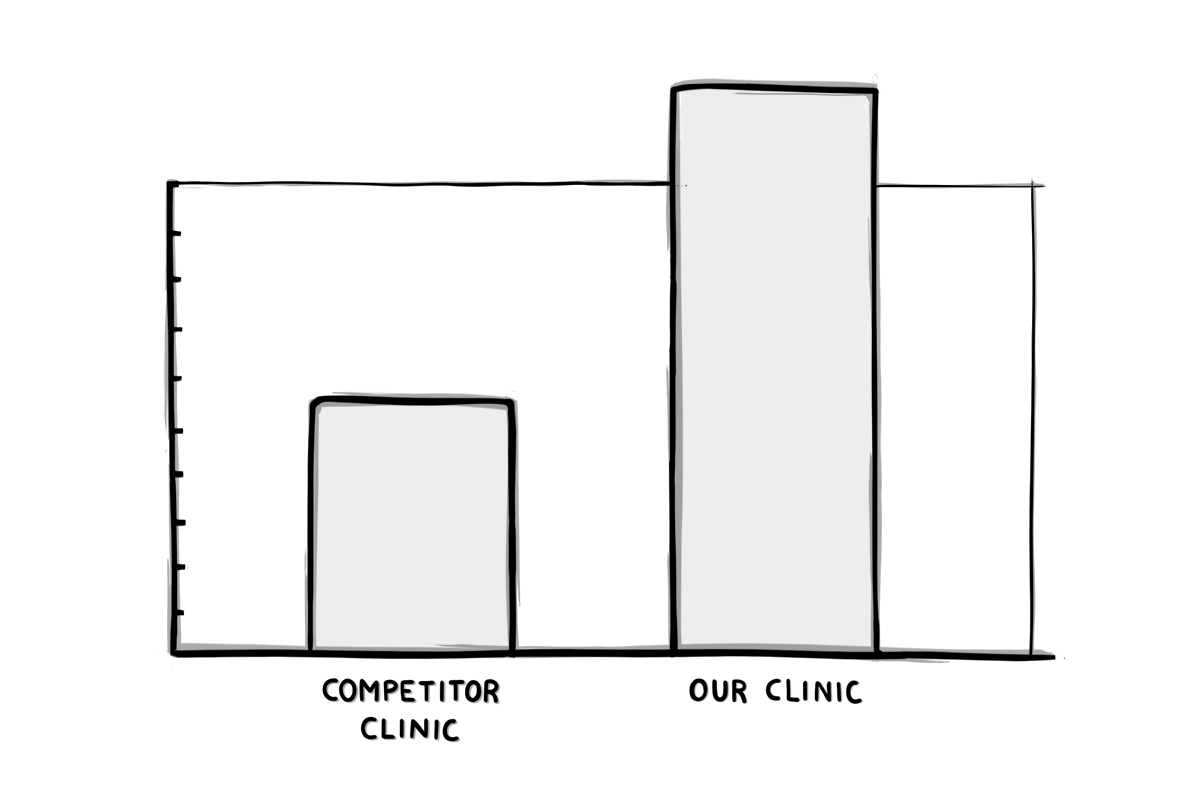
How else do clinics get cheeky with success rates?
Clinics know you’ll look at their “success rates” page – and they want you to think they’re superior to their local competitors. So they’ll often do whatever it takes to present their data in the best possible light.
Here are some other tactics to watch out for:
1: They’ll combine patient age groups in any way that will help bump up the numbers.
2: Instead of publishing birth rates, they’ll publish pregnancy rates if it makes them look better. While this is a totally legitimate way to measure things, you just need to make sure you don’t compare it to birth rates on another clinic’s site.
- CARE London, for example, makes a huge deal of its “High IVF Results in London!” and shows off an impressive-looking chart displaying “clinical pregnancies per embryo transferred”. But click on “More results” (and kudos to them for including extra stats at all on their website) and you’re faced with the reality that “Live birth rates per embryo transferred” are less impressive. In fact, they’re slightly lower than the national average, for every age group.
- Fertility Plus in London does the same thing. It mentions a 42% clinical pregnancy rate on its website, but its “live birth rate per embryo transferred” (published on the HFEA website) is slightly lower than the national average.
3: They’ll publish stats for “embryo transfer” (or “embryo transfer event”), not “embryo transferred”. See above for more on this.
4: They’ll compare their own success rates to the national average – but only when theirs looks better. Otherwise, they won’t mention the national average.
- City Fertility (also in London) cleverly compares itself to other clinics for donated egg cycles only – where the clinic seems to excel. For IVF cycles using women’s own eggs, the clinic a) only provides clinical pregnancy rates, not birth rates, and b) decided not to compare itself with other clinics.
The clinic’s live birth rates are slightly lower than the national average, according to the HFEA, so that might be why. - Salisbury Fertility Centre (one of the only two clinics that has success rates officially deemed “below the national average”) does something similar.
Once your eyes adjust to the chaos of its “success” page, you’ll see that it compares just one of its data points to the national average (where it can make itself look superior).
None of the other numbers on the page are compared to the national average – and they all use completely different measurement techniques (some are “per embryo transferred”, some are “per transfer procedure”, some are “clinical pregnancy” rates, some are “live birth” rates, etc.).
5: Their stats will be “per treatment cycle”, which is bloomin’ confusing because it means different things to different people. For most private clinics, it’s the same as an “embryo transfer event”, but for the HFEA, it refers to any IVF treatment that has begun – even if an embryo transfer doesn’t end up happening (e.g. because the patient didn’t react to the stimulation drugs).
6: They’ll be extraordinarily vague – to an infuriating degree. I feel the need to include a few screenshots so you can be just as furious as I am:
Gennet (which has a clinic in London):

WHAT DOES THIS MEAN????!!!! ARGGGHHH!
Harley Street Fertility Clinic:
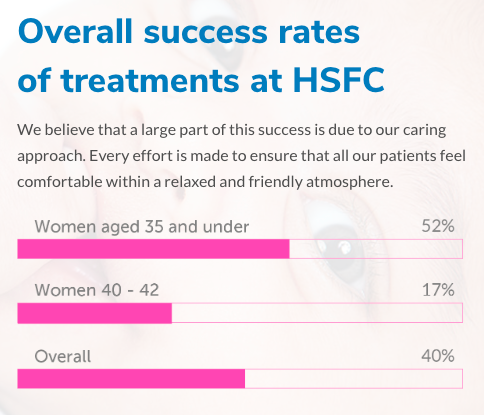
52% per embryo transferred? Per embryo transfer cycle? Per treatment cycle? Per eggs collected? Fresh? Frozen? Donor eggs? Donor sperm? Live births? Clinical pregnancies? Who flipping knows.
The Fertility & Gynaecology Academy
Are we talking clinical pregnancy rates per embryo transferred or per embryo transfer treatment?
If clinics have similarish success rates, how do I decide where to go?
At the beginning of this article, I said that almost all clinics have fairly similar success rates: trying to pick a private IVF clinic by success rate alone is like trying to bet on a horse based on the number of legs it has. The intervening 1,500 words were to show how clinics attempt to give the impression that they have far superior rates compared to the national average.
So now you know all that, how do you choose a private IVF fertility clinic if you can’t base your decision on success rates?
To answer your question, read my article on how to choose a private fertility clinic.
Questions?
Lots of readers asked me about success rates, and I figured it would be pretty easy to do the research and write up my findings. I was wrong: this subject is a minefield.
If you don’t understand anything I’ve written or need more information on something, there’s a good chance you’re not alone – so please tell me and I’ll do my best to re-explain or do some more research: [email protected]. I want to make sure this article answers all your questions and gives you the confidence you need to pick a private IVF clinic that suits your needs.